
We’re thrilled to announce that Capable Diagrams now integrates with Atlassian Rovo, Atlassian’s cutting-edge AI assistant. This powerful new integration revolutionizes how you create and insert editable diagrams within Confluence.
With Rovo’s assistance, you can instantly transform both existing content and external data into clear, interactive visuals—all with a simple text prompt.
Meet the Diagram Assistant
Our Diagram Assistant taps into the intelligence of Atlassian Rovo to make diagram creation faster, smarter, and more accessible to everyone, regardless of technical skill level. It works by analyzing content already present on your Confluence page—whether it’s text, tables, lists, or even bullet points—and generates diagrams that perfectly represent that data. The result? Editable, fully customizable diagrams that you can further refine using Capable Diagrams’ intuitive editor.
But it doesn’t stop there. You can also request data beyond what’s on your page, like widely recognized statistics or data that might help complete your diagram. All of this can be done in just a few steps, allowing you to bring complex information to life in minutes rather than hours.
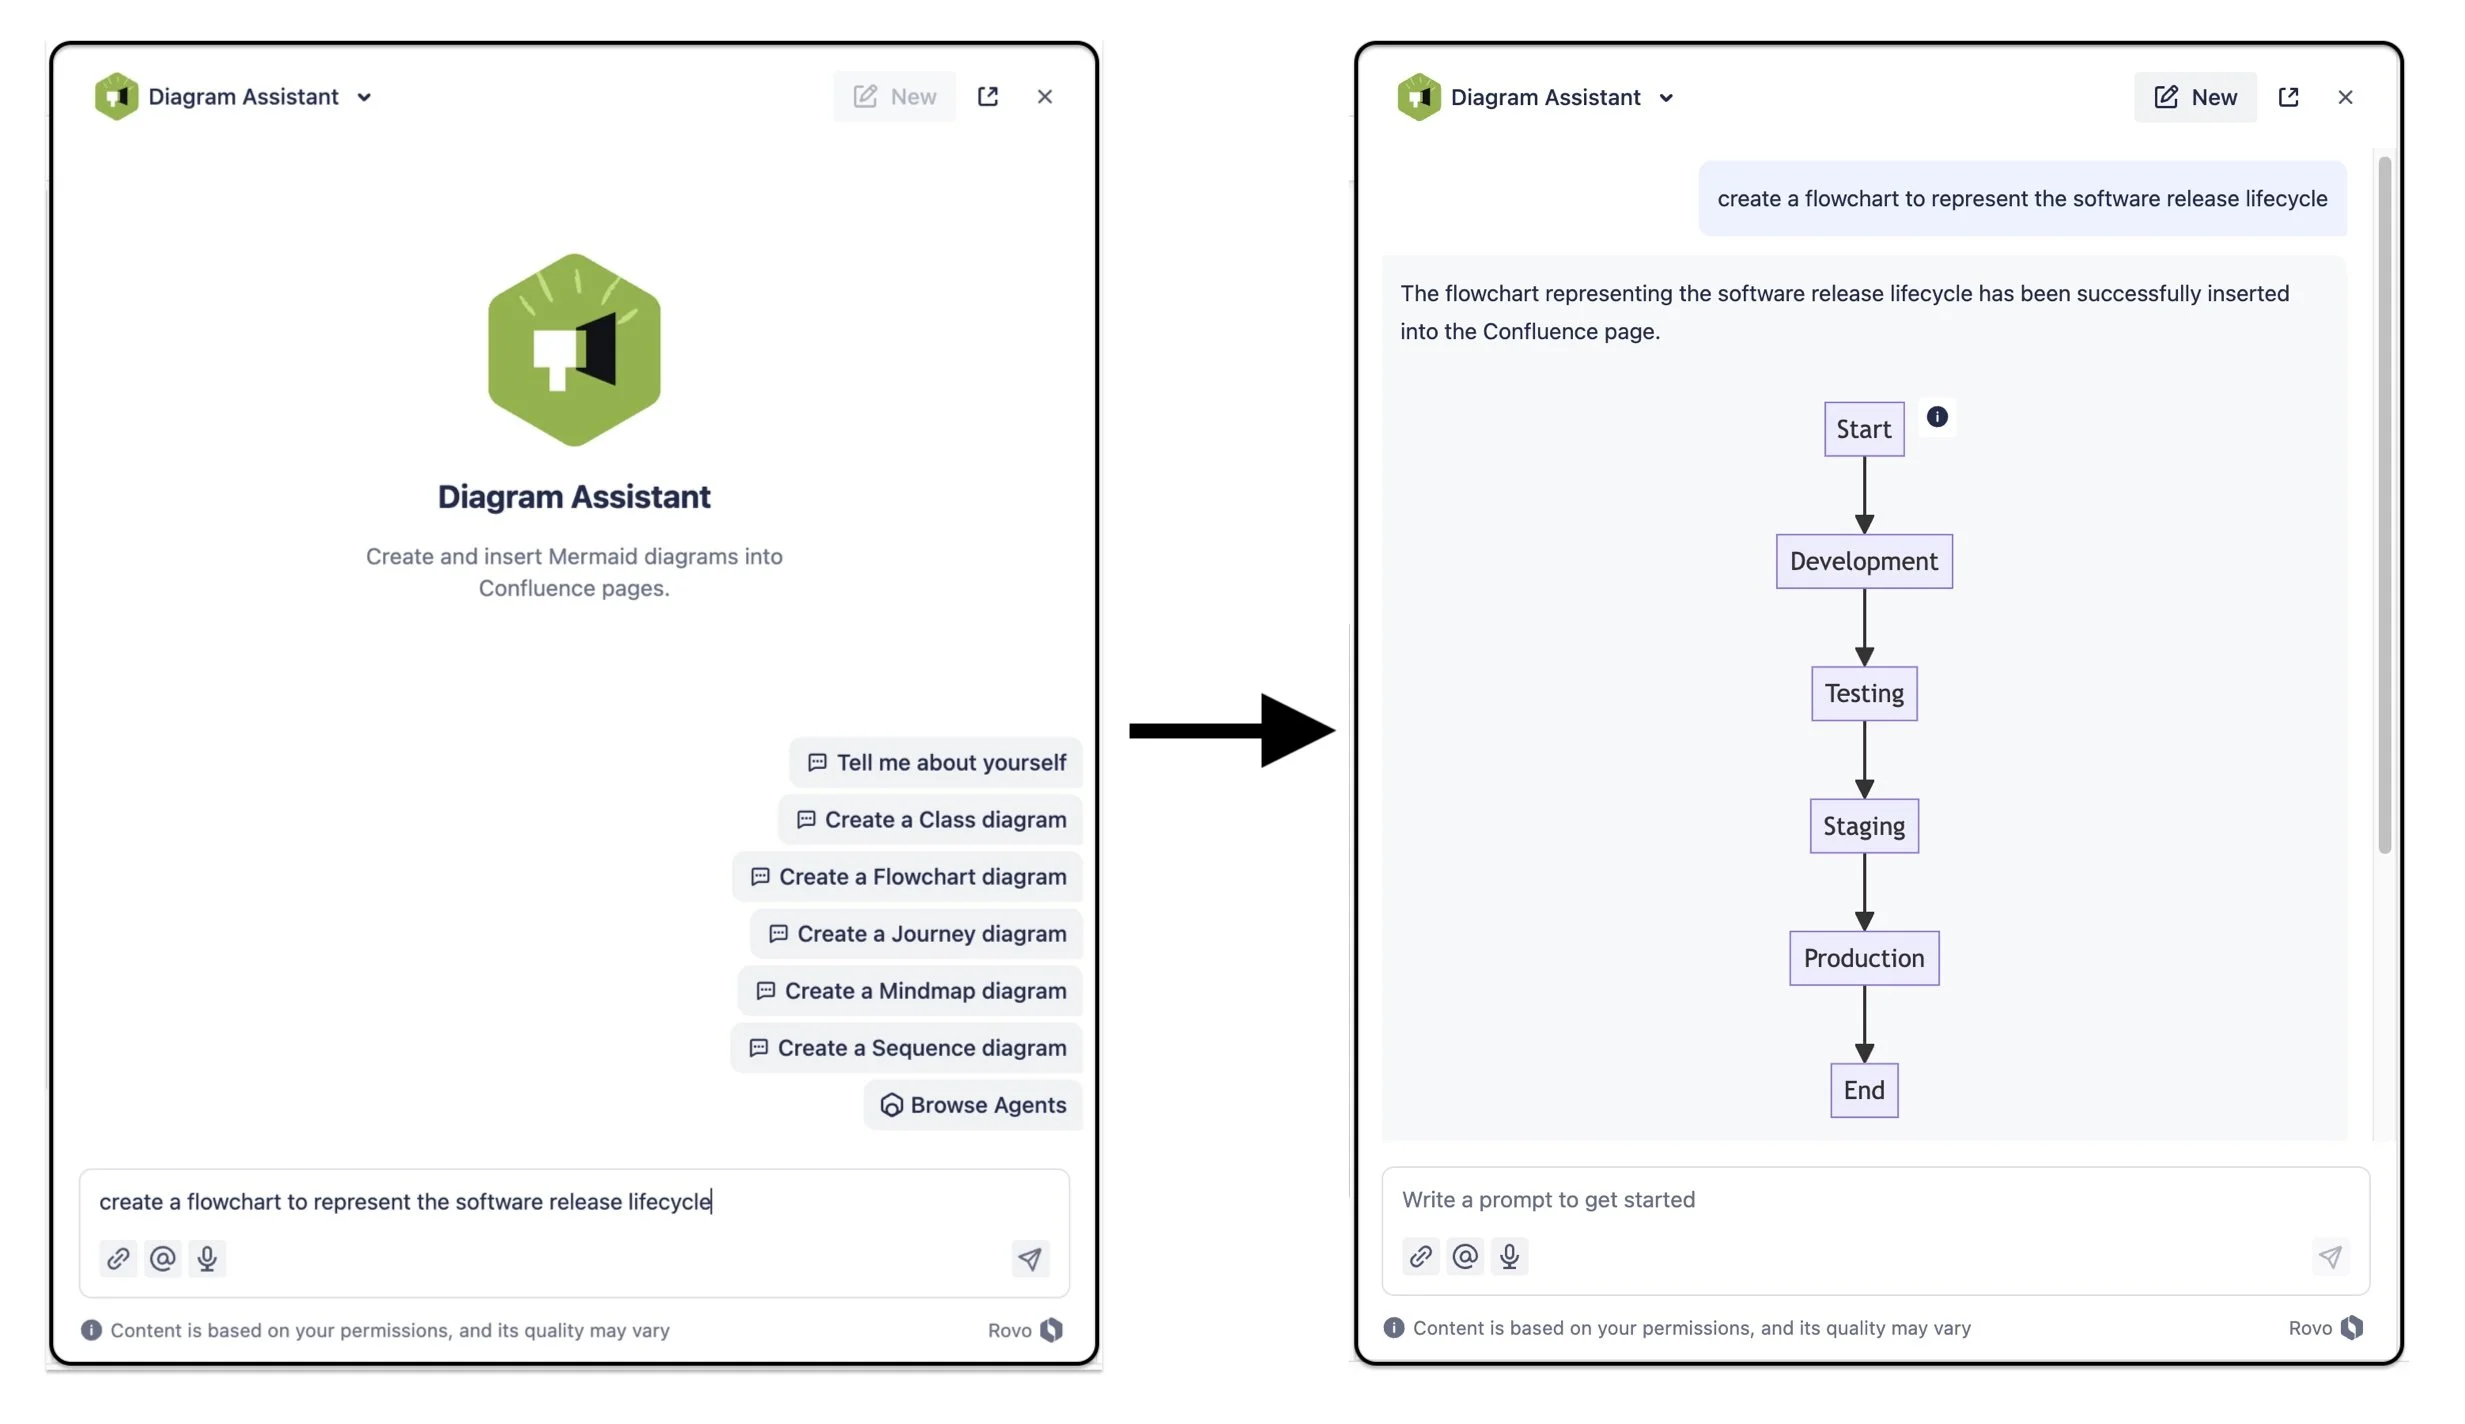
How the Diagram Assistant Works
Analyze Page Content: The Diagram Assistant reads through your Confluence page to understand the structure, lists, and tables, extracting key points and relationships.
Provide a Text Prompt: You provide a simple text prompt like “Generate a flowchart from this list” or “Create a pie chart using the numbers from this table,” and Rovo instantly builds an editable diagram that you can then insert into the page.
Refine with Capable’s Editor: Once Rovo has generated the diagram, you can further adjust its appearance, format, and structure using the Capable Diagrams editor—no complex software or manual data input required.
Incorporate External Data: Need additional data that’s not on your page? Rovo can retrieve relevant information, like the population of cities or other well-known figures, and use it to enhance your diagram.
3 Game-Changing Use Cases for the Diagram Assistant
Here are three powerful ways that teams can use Capable’s Diagram Assistant in everyday scenarios to supercharge their workflows:
1. Automatically Generate Org Charts from Team Bullet Points
Have a bulleted list of team members and roles on your Confluence page? With the Diagram Assistant, you can turn that simple list into a fully editable organizational chart in seconds. Rovo scans your page, identifies the relationships between team members or departments, and constructs a visually appealing org chart.
No need to manually map out team structures or export the data to another tool—everything is done directly within Confluence, and you can easily tweak the diagram to match any changes in your organization.
This feature is perfect for quickly visualizing team hierarchy for onboarding, project planning, or internal presentations.

2. Instantly Create Flowcharts from Step-by-Step Processes
If your Confluence page contains a detailed process or workflow explained in bullet points or a numbered list, the Diagram Assistant can transform it into a flowchart with just one prompt. Whether it’s a step-by-step breakdown of a project’s stages or a troubleshooting guide, Rovo can create a flowchart that illustrates each phase clearly.
For example, if you have a list of actions that your team needs to take to resolve a customer issue, the Diagram Assistant will analyze the list and turn it into a flowchart showing decision points, dependencies, and outcomes. You can then edit the flowchart using Capable’s editor, adding custom icons, colors, or additional details.
This use case streamlines process documentation, making it easy for teams to follow instructions or refine complex workflows.

3. Visualize Data with Charts from Table Data
Do you have a table of numbers or data on your Confluence page? Let Rovo transform it into a sankey chart with just a quick command. Whether you’re presenting project statistics, sales figures, or resource allocations, the Diagram Assistant can automatically generate a pie chart that breaks down the data into an easy-to-read visual.
Simply ask Rovo to create a sankey chart from the table, and within moments, your data will be translated into an editable diagram that you can further refine in the Capable editor. This eliminates the need to export data to a separate tool, making it easier to keep everything centralized in Confluence.
This feature is invaluable for project managers, business analysts, or anyone who needs to present data-driven insights without wasting time manually creating visuals.
